Nowadays it is indisputable to say that technology is becoming increasingly viable, a strong ally of Agro. Essentially, providing different levels of digital and technological growth in the properties of higher productivity, reducing and optimizing resources, in addition to providing a farmable diagnosis.
One of the digital study studies, or Agriculture 4.0, is the use of remote sensing, in which way data from agriculture, i.e. satellite imagery, provide information and diagnostics about what is in specific fields with the crop over time. . Next, we will understand what NDVI is and what is its usefulness and importance in the day to day of the field.
What are NDVI images?
It is an acronym that stands for “Normalized Difference Vegetation Index”, that is, an index that evaluates the real condition of a crop, being a good example of how satellite images can be used in agriculture.
Basically, from the images coming from the satellite, some bands of evidence are taken to make an image, which looks for if there is no ground or there is no observation presence. In the case of NDVI, it is an indicator of photosynthetically active biomass which, in other words, represents how healthy the vegetation of the place is. Thus, it allows both to identify what is or is not the crop, as well as to define its general state.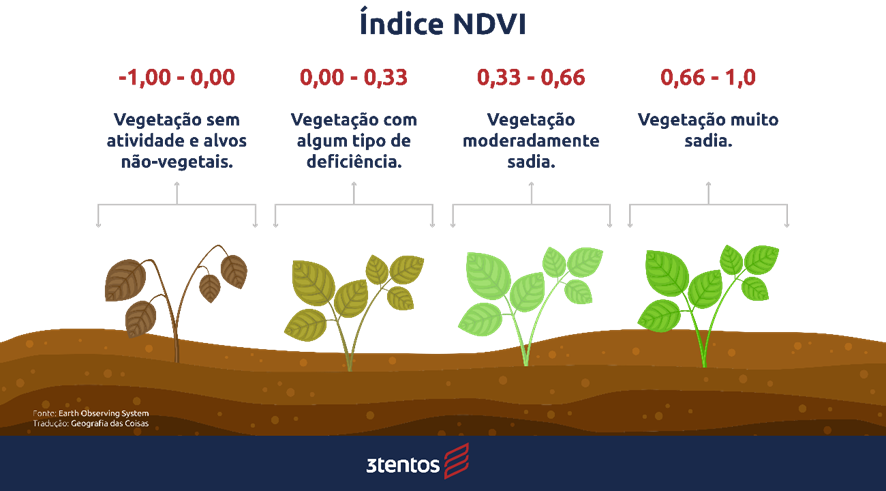
What does each of the colors returned in NDVI mean?
result of variations of their values -1 to 1. Specific values of regions of dense vegetation or of objects such as surfaces of living water and clouds, ie, as presence of water plants and clouds, as there is no presence of water and clouds.
The uncovered soil is indicated within the range of 0.1, therefore, all values 0.2 1 are those that correspond to the presence of proximate. As a general rule, the closer to 1 the healthier the plant.
Then we can divide these values (above 0.2) into three ranges, as shown in the image below. Values between 0.2 and 0.33 are for vegetation with some type of deficiency, whereas values between 0.3 to 0.66 correspond to moderately healthy vegetation. Values above that, between 0.66 and 1, are from a lot of forest. The following image illustrates the best ratios:
Analyzing indexes in maps and their applications
Now that we know the meaning of each of the index values, it's time to generate maps with this data. Traditionally, this is a map of colors ranging from red to dark green. On this scale, red corresponds to values closer to -1 (dead or non-existent vegetation) and the parts in green correspond to values closer to 1 (healthy or denser vegetation).
3Tentos has its own software that identifies and generates these maps. The program is used by our consultants, enabling remote monitoring of the crop, diagnosing healthier points and other points that need more attention, and that may possibly be suffering from specific problems. Here's a real example of tracking an area:
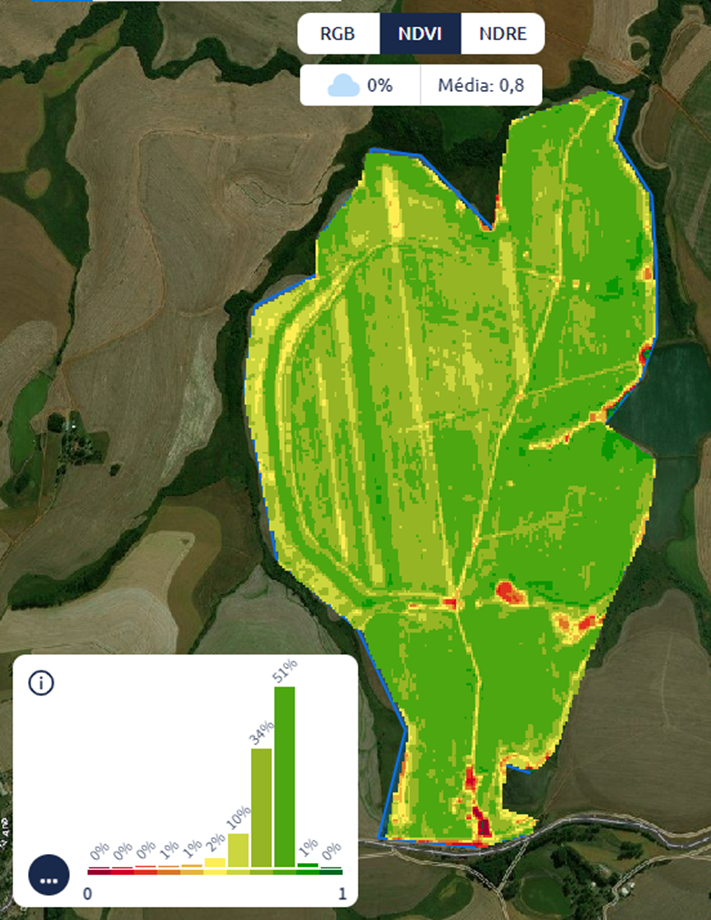
According to the color scale of the green points, it is possible to check the stripes and their distribution in the field. By comparing the plantations during the same season, and even in different seasons, it is possible to categorize the plots into management zones, that is, divisions that classify the areas according to their productive potential. In this logic, there are several possibilities for using this data for the field, considering the heterogeneity of each plot to make optimized interventions, such as:
- Distribution of fertilizers;
- Variable rate sowing;
- Productivity Prediction;
- Analysis of sowing conditions;
- Analysis of germination uniformity;
- Plant health analysis;
- Identification of patches of pathogens or pests;
- Supervise water conditions;
- Spray failures;
- Comparisons of different managements.
Do NDVI and Digital Agriculture work?
Intensified production systems, that is, those that use more inputs, are substantially benefited by NDVI technology. Several study fronts have been developing research around the technology and proving its effectiveness, in addition to attributing new possibilities to the tool.
Therefore, it is an extremely useful technology for the assessment of plant health, enabling more precise investigations into possible problems that may be occurring. By working with the inputs in a localized way, it is possible to distribute what is needed, where it is needed, when it is needed and how much it is needed.
The generation of these maps and management zones, together with the follow-up of the next crops, can become planning tools for the farmer. With this information in the palm of your hand, it is possible to build a solid plan that helps in decision making, such as: planning the acquisition of inputs, setting up the crop and cultivar area plan, scheduling interventions in the areas, organizing the staff , etc.
The digitization and technification of crops through digital agriculture is revolutionary. At the moment we live in modern agriculture, the use of these technologies will guarantee several benefits for those who make good use of these resources, whether to increase their earnings, reduce their costs or even optimize their processes from the gate to the inside.
As such, data-based decision making will provide a new insight into the experience of those living in the countryside, combining the value of farmers' knowledge of life with the best that technology has to offer. 3Tentos has been developing Digital Agriculture and remote sensing tools to provide quality technical advice. Very soon we will see our partners enjoying even more of the whole apparatus of technologies and information, which will increasingly be part of their daily lives.