Considered an ingredient of high food value due to the concentration of proteins and essential amino acids, bran is one of the by-products from the processing of soybeans. Along with the bran, soybean oil and husk are produced.
In Brazil, what is done with soy after harvest?
Let's use the year 2020 as an example. That year, Brazil harvested approximately 125 million tons of soybeans and 46.8 million tons were processed on national soil, or 37% of the volume. The remainder was destined for export via in natura grain and a small fraction was left as carry-over stock for the next year.
The result of all this processed volume, in addition to soybean oil and hulls, was approximately 36 million tons of soybean meal. Most of this volume, 52%, stayed here in Brazil for domestic consumption and the rest was exported, with the European Union being the main destination. The average yield of Brazilian soybeans is 77% bran, 20% oil and 3% husk.
The annual domestic consumption of Brazilian meal is approximately 18 million tons. This amount is basically divided into 3 large sectors, 60% of this volume goes to poultry, 25% to swine and 13% to beef and dairy cattle. The states that most consume soybean meal are Paraná, with 21% of the volume, followed by Santa Catarina, Rio Grande do Sul, São Paulo and Minas Gerais, which together represent more than 65% of national consumption.
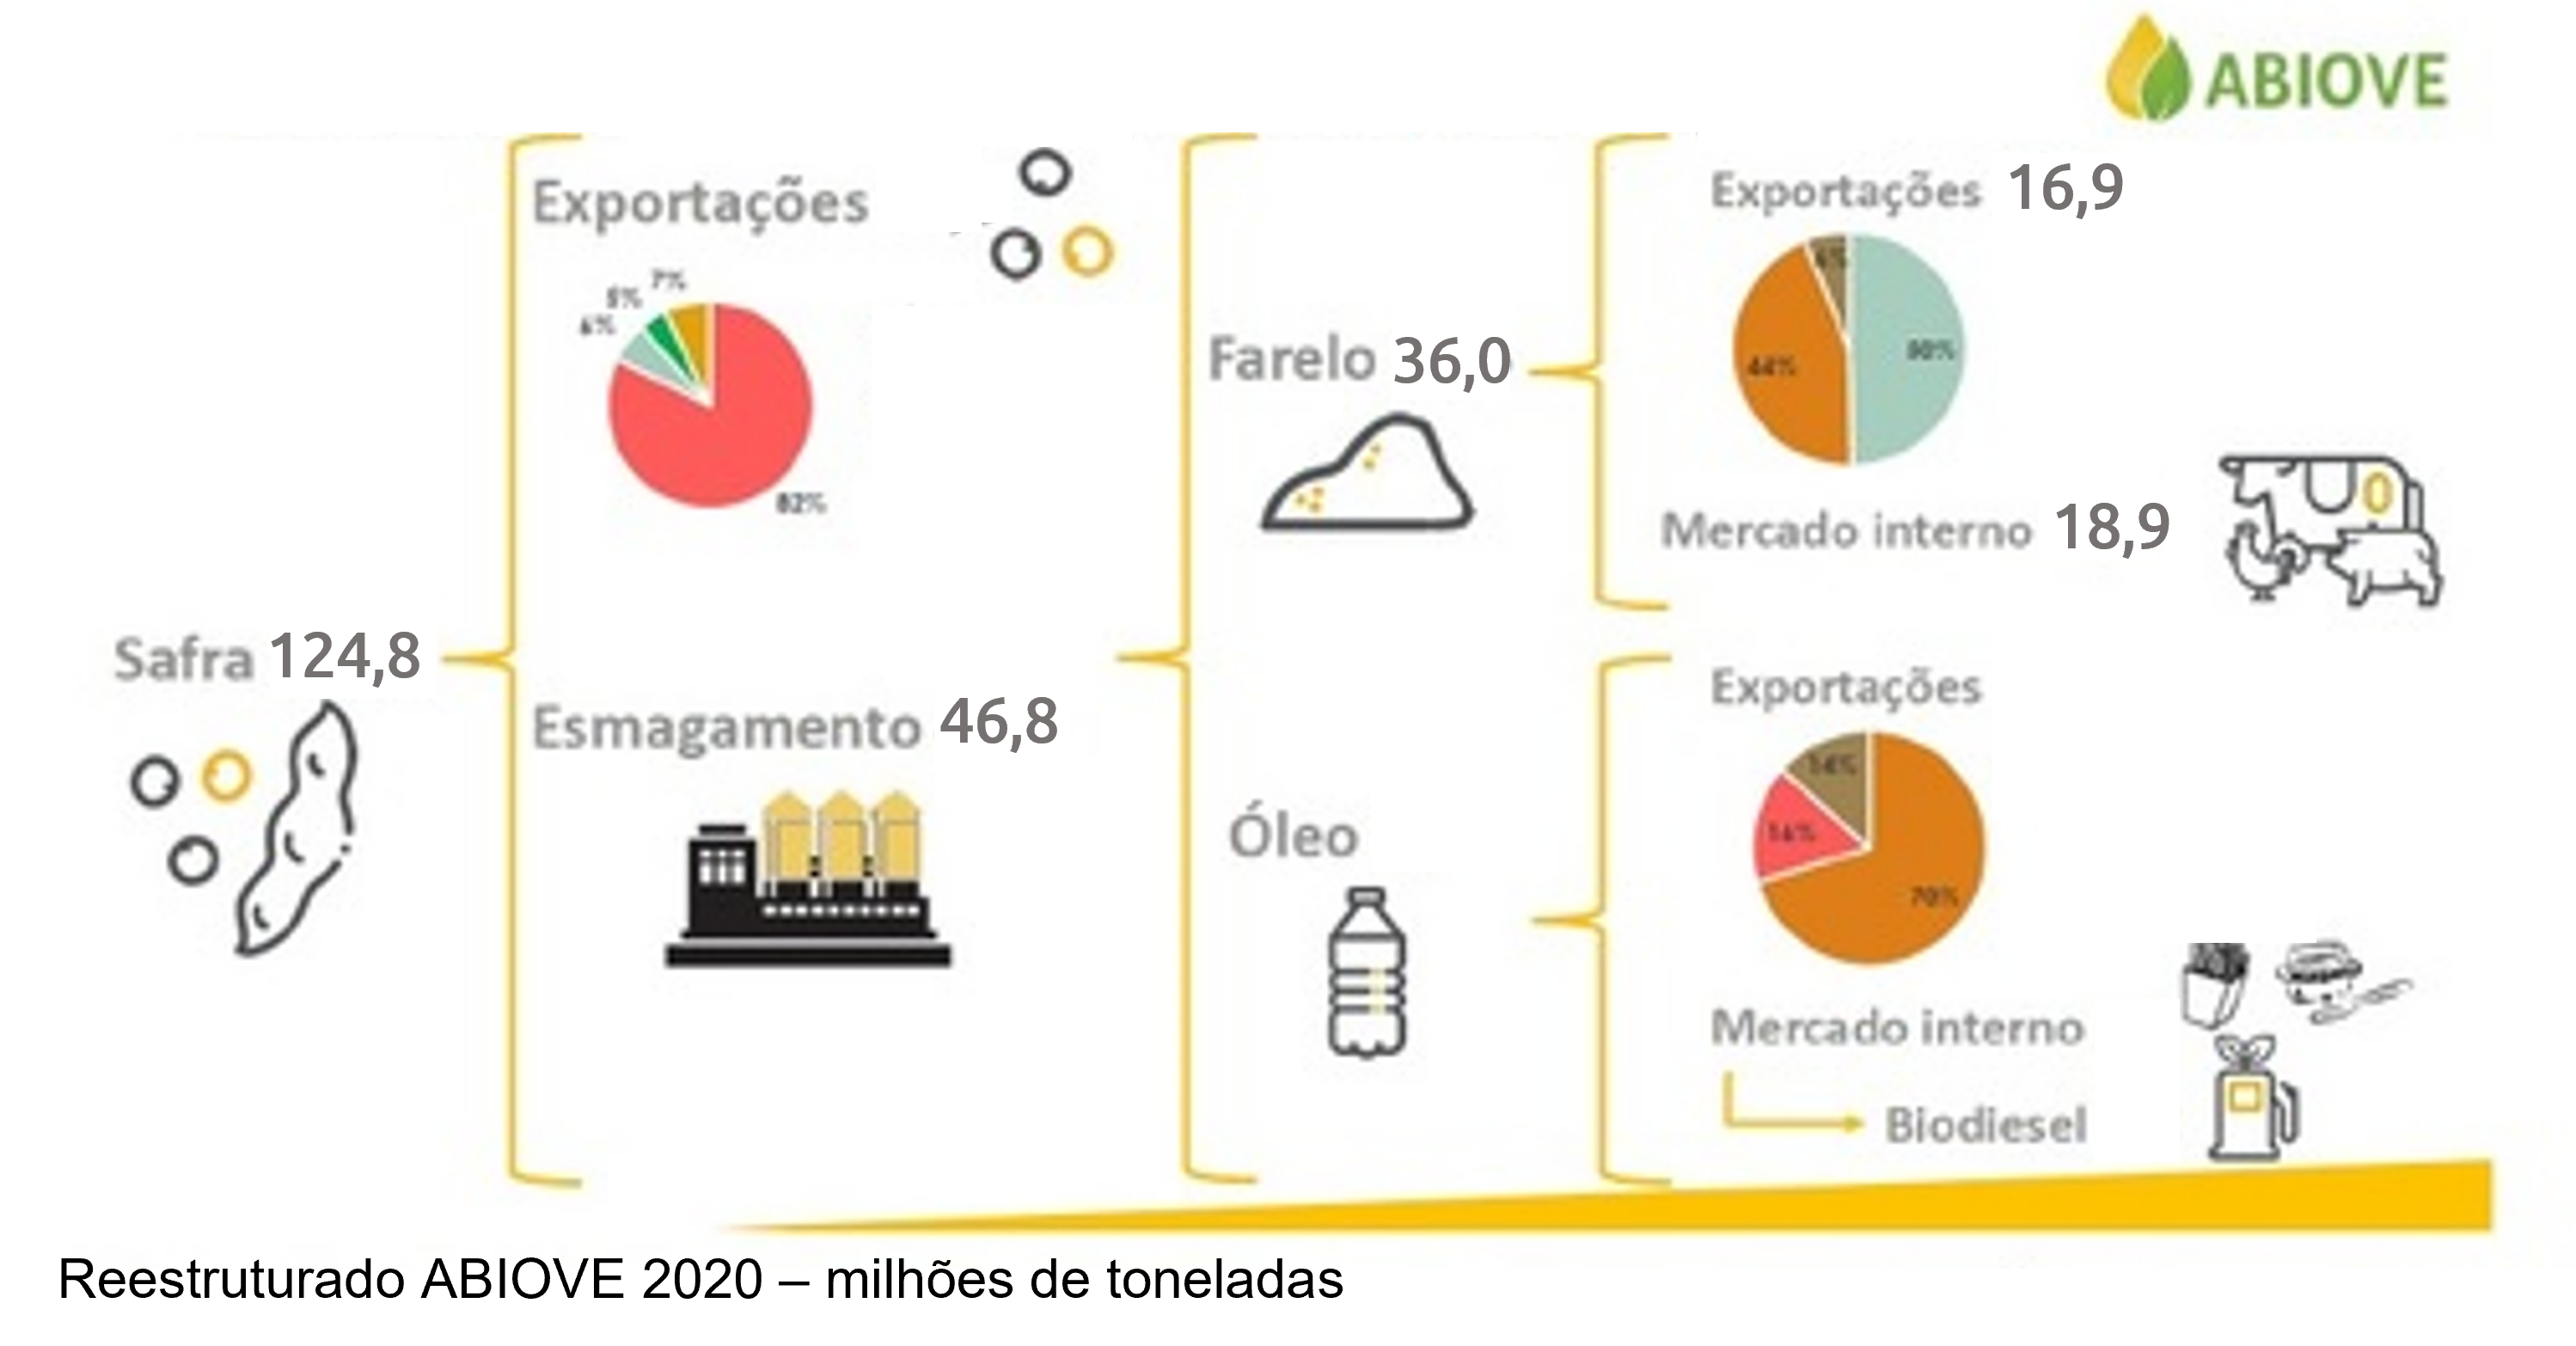
Soybean meal chain in Brazil - ABIOVE
And in Rio Grande do Sul?
Rio Grande do Sul follows a very similar pattern to what we saw in Brazil. The state has large herds that consume soybean meal, there are more than 13 million cattle, 5 million pigs and 19 million chickens, which together consume approximately 2.8 million tons of soybean meal per year.
The mountainous region, in the northeast of the state, is the most frequent destination for bran in Rio Grande do Sul, as it is there that a large part of the poultry production chain is found, which, together with the swine chain, is also found in the northwest. in the state, represent more than 90% of bran consumption in Rio Grande do Sul.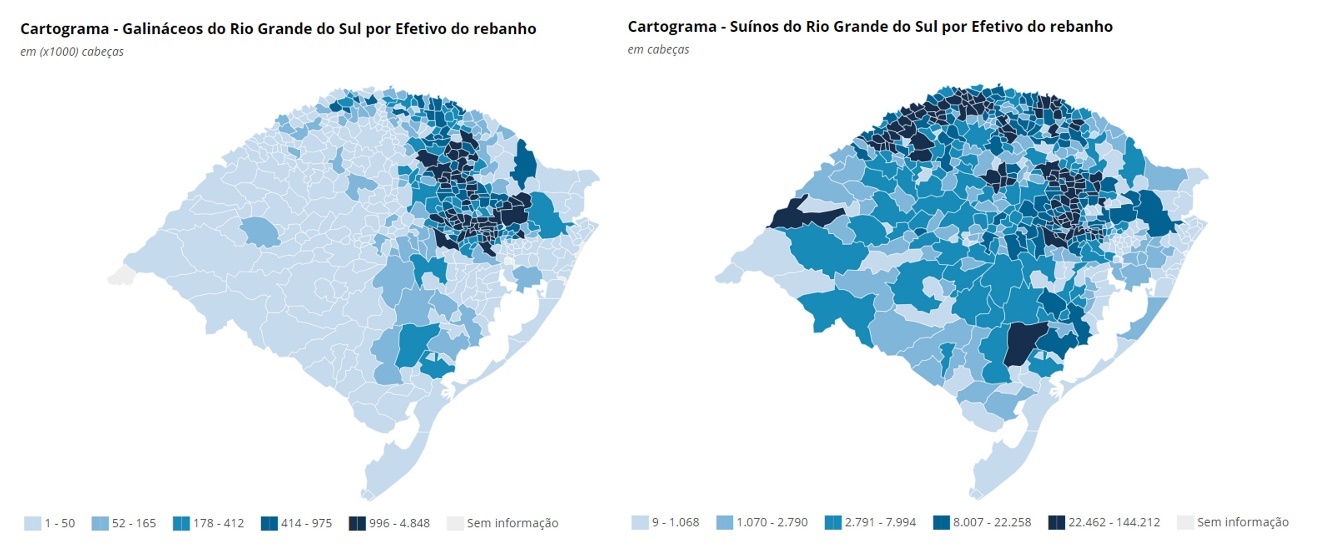
Distribution of chickens and swine in Rio Grande do Sul - IBGE
Today, Rio Grande do Sul has more than 20 industrial parks that together have an installed capacity to process almost 30,000 tons of soybeans per day, thus being able to generate more than 22,000 tons of soybean meal. In order to dispose of the entire volume of non-exported meal, the state also has more than 140 feed production factories that, among the raw materials, use soybean meal.