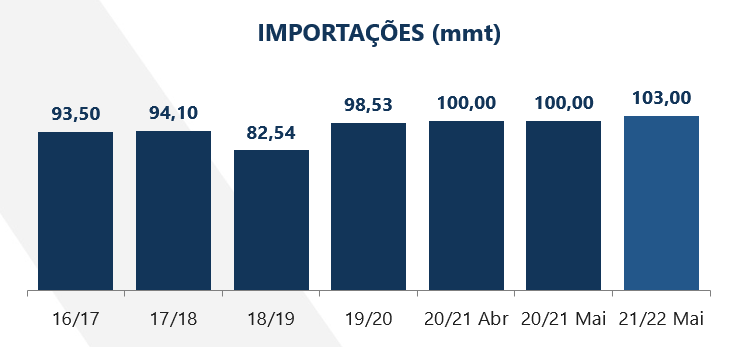
After 2019, China begins to rebuild its swine herd, after the episode of the African Swine Fever (PSA) that devastated the Chinese herd and impacted world consumption. The Asian giant's imports jumped from 82.5 million tons in 2018/19 (cycle impacted by the PSA) to estimates of 100 million tons in that cycle (2020/21) and projections of 103 million tons for the next one (2021 / 22).


This Chinese appetite in the world market was one of the factors that helped in the reduction of US soybean stocks, besides, of course, the reflection of lower production, due to weather problems. The United States, whose export estimate for this cycle is being projected at 62 million tons, has already exported 99% of that volume, leaving its estimated ending stocks at around 3.25 million tons. In such a way, the import market was at the mercy of the South American harvest.
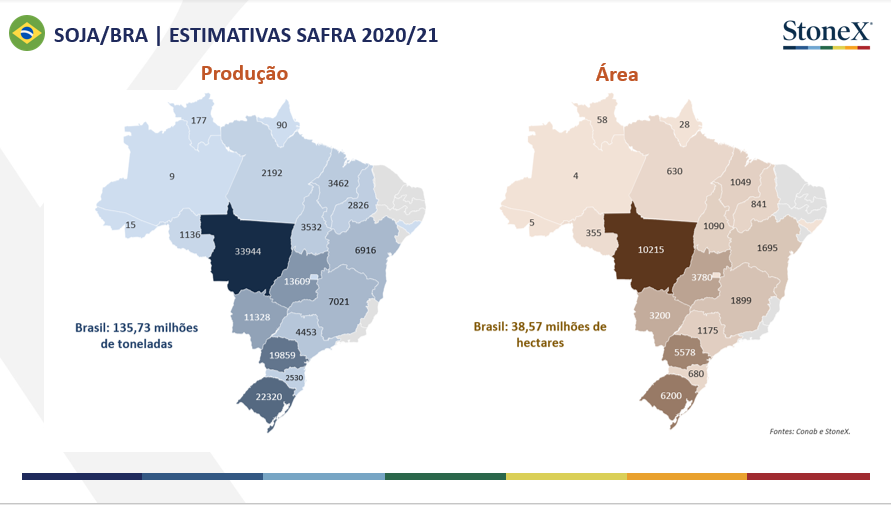
Despite the reduction in the productive potential of the Argentine crop, Brazil produced a record 135.73 million tons (StoneX estimates), about 11 million tons more than in the previous cycle (124.5 million tons 2019/2020) . This is all due to the 4% growth in the total sown area in the country, which reached 38.6 million hectares. Furthermore, despite the losses in the final stretch of the harvest due to excessive rainfall in important producing states such as Mato Grosso and Paraná. The state of Rio Grande do Sul ended up surprising and, with the area growth that is followed year after year, mainly to the detriment of the southern region of the state, it obtained a production of more than 22 million tons of soy, taking the state to the position second largest producer of grain in the country. On the other hand, the Brazilian pace of soy shipments to also remain firm, more than 50 million tons of the total estimate of 85 million, have already been exported until mid-May.
Currently, the USDA projects an area of 35.09 million hectares in the case of soybeans and a final production of 119.9 million tons. And in corn, 33.8 million hectares and 380.8 million tons of production. However, it is still possible to see adjustments in both areas, which could represent higher production and reflect in the final inventories. Weather expectations are positive, but it is still early for further definitions about the American crop, as the months of July and August are important for the completion of the crop there.
But how does all this information relate to the price of soybeans?
In the case of soybeans, there are three variables that form the price:
The quotations of the Chicago Stock Exchange, which are influenced by the world supply and demand of the grain;
The premium, which reflects demand appetite and can be explained as a premium or discount paid on stock quotes;
The exchange. Remembering that in the domestic market the product is traded in reais - national currency.
All the information mentioned so far has a direct interference in the components of price formation and can, therefore, modify or maintain the market trajectory. The fact is that we are experiencing a scenario of rising demand and we need good harvests to rebuild stocks, so that supply is able to meet this demand.
And the corn market?
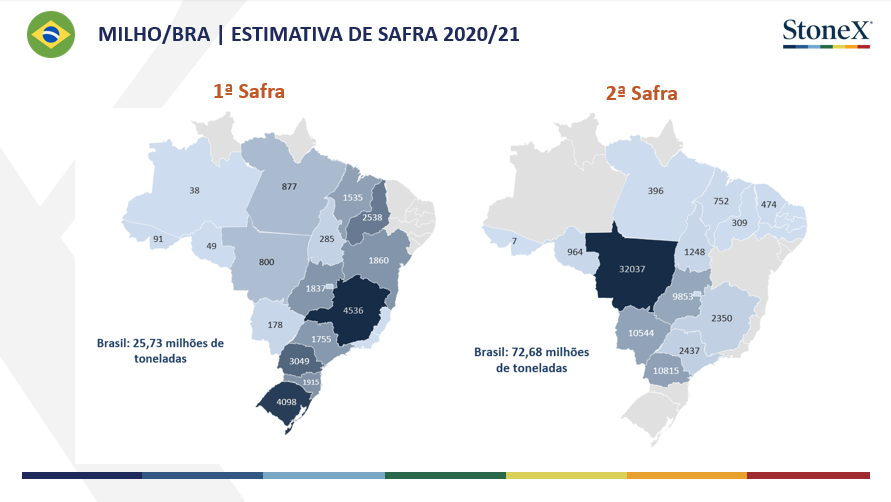
Given the high prices of corn in the country and a lower offer, the competitiveness of the cereal in the foreign market has been impacted, that is, a reduction in total grain exports in this 2021 cycle is already believed. the balance of supply and demand for Brazilian corn remains very tight, remembering that availability in the first half of the year (already considering the scenario for 2022) will depend on the summer crop, which is much smaller than the off-season.
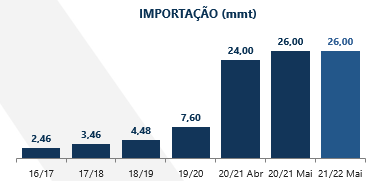
Outside, the market is attentive to the growth in the use of corn for the production of Ethanol in the USA, which is expected to increase by 4.5% in the 2021/22 cycle (more than 5 million tons) and, remembering, China started to figure as an importer in the world corn market. North American exports also tend to be high. Corn prices in China have risen more than a third in the most recent year, after a drop in production and state stocks. The country started to import more corn to make up for the internal deficit and this has been reflected in world cereal prices.


